


by Eric Marshall, CFA, on Apr 20, 2023
“The more difficult it is to take action in the market, the more likely it is to be successful.” – Dick Davis
The first quarter of 2023 proved to be another volatile one for U.S. stocks as market sentiment shifted daily between pricing in a hard, soft, or emergency landing for the economy. The S&P 500 increased by 7.50%, and the NASDAQ Composite was up 14.74% in the recent quarter, reflecting a recovery in mega-cap tech stocks. However, the leadership breadth of the S&P 500 was tepid when considering that the S&P 500 on an equally weighted basis was up only 2.93% (based on S&P500 Equal Weight Index). As measured by the Russell 2000, small-caps rose 2.74% in the quarter, lagging due to their cyclical sensitivity and exposure to regional banks. Value stocks have underperformed growth this year as economic uncertainty and tighter credit conditions have created an expectation that interest rates may stabilize and could contract by year-end if economic conditions worsen. While turbulence surrounding bank failures and systemic risk to financial markets is unsettling, we are pleased to report that three Hodges Mutual Funds generated positive first quarter 2023 returns relative to their respective benchmarks. Positive relative performance in several of our fund strategies was attributed to our steadfast focus on companies with sound business fundamentals and reasonable valuations.
It has been a full year since the Fed started its tightening cycle, and capital markets have at least partially priced in one of the most anticipated recessions in the past forty years. However, there is still ample uncertainty regarding the trajectory of interest rates and the prospects for changing economic conditions in the months ahead. In our opinion, the first-quarter relief rally in many mega-cap tech stocks has been a function of a false flight to safety based on the anticipation that softer economic conditions could result in lower rates and higher valuations for growth stocks in the second half of this year. We view the broad contraction in PE multiples relative to current interest rates over the past year as warranted. According to the most recent data published by FactSet, the S&P 500 is trading at approximately 17.8X forward earnings estimates compared to 19.5X a year ago and 21.2X at the beginning of 2022. The inverse of the current S&P 500 PE multiple reflects an earnings yield of 5.56%, which was still above the 10-year Treasury yield of 3.56% at the quarter-end. The big macro questions are now; Not if, but how much will the U.S. economy contract, and to what degree will it drag on corporate earnings and cash flow? We would point out that many businesses have spent the last six months cutting costs, scrutinizing capital expenditures, tightening supply chains, and cautiously managing inventories in anticipation of a slowdown. However, the inevitable contraction in bank lending and tighter credit be challenging for those business and industries dependent on accessing easy credit.
This will sometimes create opportunities for companies with conservative balance sheets, low-cost operations, and ample liquidity to weather a downturn. Our investment team's recent discussions with public company management teams over the past few months suggest that labor costs are stabilizing, and many other input costs have also been moderated in recent months. Consumer spending increased last year due to excess savings built up during the pandemic but appears more challenging in 2023. The housing market has cooled down due to higher mortgage rates but does not appear to be overbuilt. The most recent Purchasing Managers Index (PMI), which measures the direction of economic trends in manufacturing and service sectors, fell below 46.3, a reading that has historically occurred during or just before a recession. Although the odds of a recession have risen this year, we believe many facets of manufacturing could undergo a renaissance over the next several years due to onshoring and nearshoring supply chains and an increase in infrastructure-related spending. It is also important to note that not every economic slowdown looks the same, and not every business will be affected the same by potential macro headwinds. In this environment, active portfolio management becomes essential to navigate quickly changing business conditions across many sectors. Furthermore, an economic slowdown and tighter credit conditions has favored stocks with solid balance sheets whose underlying assets may produce stable cash flow and earnings. With this in mind, the Hodges Capital Management investment team has positioned our portfolios to potentially benefit from shifting economic trends and secular and structural changes across different industries.
As we look at the balance of 2023, our portfolios remain laser-focused on fundamental investing and individual stock selection. Our investing approach involves spending little time predicting short-term fluctuations in interest rates, foreign currencies, or commodity prices. Instead, we pay close attention to how prices and, more importantly, the pricing power that our portfolio companies exhibit within the goods and services they produce. For many businesses, tighter credit conditions and a slowdown in demand could adversely impact profit margins and revenues in the months ahead. As a result, the investment team at Hodges Capital is rigorously looking for bargains in businesses that we believe are well-run and control their destiny by relying on ingenuity and well-calculated business decisions rather than day-to-day momentum in the economy or stock market. Despite challenging macro conditions, we are overweighting our portfolios with growth and value stocks that can create shareholder value.
During this time of ambiguity, investors in the Hodges Funds can be assured that we are not changing our core investment discipline, designed to seek out quality companies running great businesses with excellent management teams trading at reasonable prices. Furthermore, we see this as an ideal environment for active portfolio managers to carefully select individual stocks that we believe can generate long-term value for shareholders.
Returns (% Retail Class) as of 3/31/2023
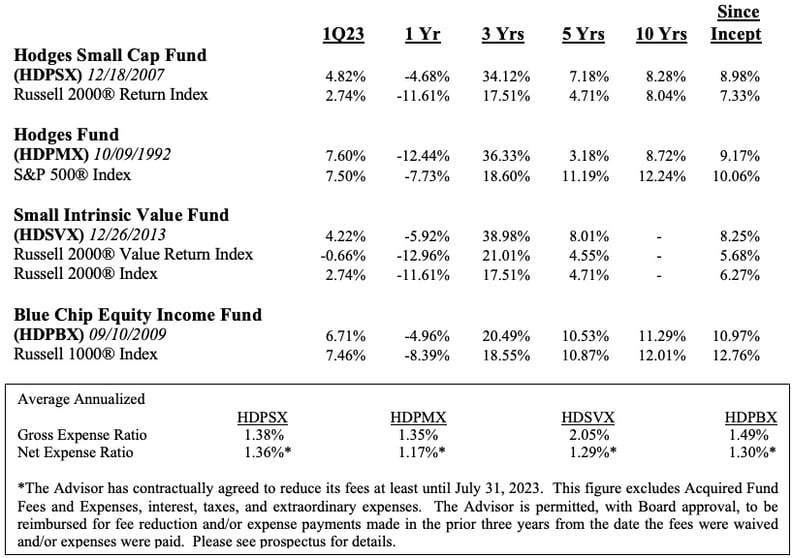
Performance data quoted represents past performance and does not guarantee future results. The investment return and principal value of an investment will fluctuate so that an investor's shares, when redeemed, may be worth more or less than their original cost. The current performance of the Funds may be lower or higher than the performance quoted. Performance data current to the most recent month-end may be obtained by calling 866-811-0224. The Funds impose a 1.00% redemption fee on shares held for thirty days or less (60 days or less for Institutional Class shares). Performance data quoted does not reflect the redemption fee. If reflected, total returns would be reduced.
Hodges Small Cap Fund (HDPSX)
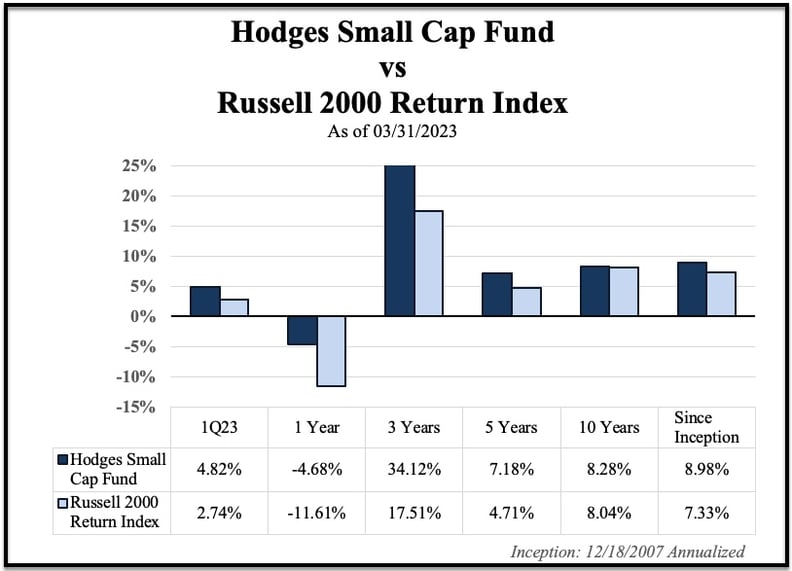
The return for the Hodges Small Cap Fund amounted to a gain of 4.82% in the first quarter of 2023 compared to an increase of 2.74% for the Russell 2000 Index. The Small Cap Fund's one-year performance on March 31, 2023, amounted to a loss of 4.68% compared to a loss of 11.61% for the Russell 2000 Index during the same period. Although small-caps have been underperforming large-cap stocks this year, we view the current risk-reward for holding quality small-cap stocks as attractive. While small-cap stocks tend to experience greater volatility during a period of market turmoil, we expect this segment to generate above-average relative risk-adjusted returns over the long term.
The Hodges Small Cap Fund remains well diversified across industrials, transportation, healthcare, technology, and consumer-related names, which we expect to contribute to the Fund's long-term performance. The Fund recently took profits in several stocks that appeared overvalued relative to their underlying fundamentals and established new positions with an attractive risk/reward profile. The Fund had a total of 51 positions at March 31, 2023. The top ten holdings amounted to 37.05% of the Fund's holdings and included Eagle Materials Inc (EXP), Matador Resources (MTDR), SM Energy Co (SM), Taylor Morrison Home Corp (TMHC), On Holding (ONON), Texas Pacific Land Corp (TPL), Cleveland-Cliffs Inc (CLF), Vista Outdoor (VSTO), Hilltop Holdings Inc (HTH), and Encore Wire Corp (WIRE).
Hodges Small Cap Fund vs Russell 2000 Return Index
Hodges Fund (HDPMX)
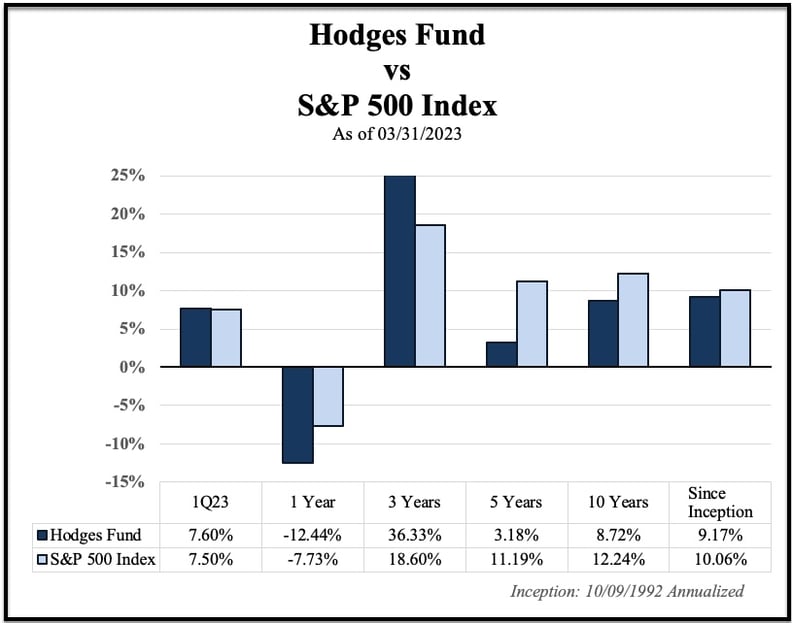
The Hodges Fund's first quarter of 2023 return amounted to a gain of 7.60% compared to an increase of 7.50% for the S&P 500 Index. In the recent quarter, positive performance was attributed to a handful of consumer discretionary, healthcare, and technology stocks. The Hodges Fund’s turnover was again elevated in the recent quarter to take advantage of volatile market conditions. We have upgraded many portfolio holdings into stocks that we believe offer above-average returns relative to their downside risks over the next twelve to eighteen months.
The Hodges Fund's portfolio managers remain laser-focused on investments where we have the highest conviction based on fundamentals and relative valuations. The number of positions held in the Fund at the end of the recent quarter increased from 40 to 43. On March 31, 2023, the top ten holdings represented 44.61% of the Fund's holdings. They included Matador Resources Co (MTDR), Uber Technologies (UBER), Texas Pacific Land Corp (TPL), On Holding (ONON), On Semiconductor (ON), Encore Wire Corp (WIRE), Cleveland-Cliffs Inc (CLF), Chesapeake Energy Corp (CHK), Cinemark Holdings (CNK), and Eagle Materials Inc (EXP).
Hodges Fund vs S&P 500 Index
Hodges Small Intrinsic Value Fund (HDSVX)
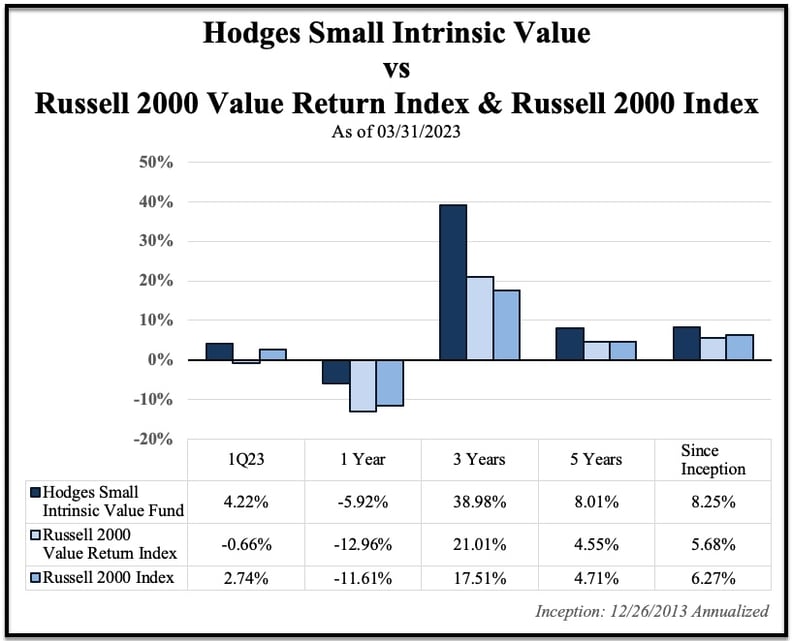
The Hodges Small Intrinsic Value Fund experienced a gain of 4.22% in the first quarter of 2023 compared to a loss of 0.66% for its benchmark, the Russell 2000 Value Index. The one-year annualized return amounted to a loss of 5.92% compared to a loss of 12.96% return for the Russell 2000 Value Index. The Fund's solid relative performance over the past year was attributed to several of the Fund's material, consumer staples, and industrial stocks. The Fund increased its positions from 46 to 49 for the quarter ending March 31, 2023. The top 10 holdings excluding cash represented 32.11% of the Fund's holdings and included Eagle Materials Inc (EXP), Triumph Financial Inc (TFIN), Taylor Morrison Home Corp (TMHC), Builders FirstSource (BLDR), Brunswick Corp (BC), Chord Energy Corp (CHRD), Vista Outdoor Inc (VSTO), Cleveland-Cliffs Inc (CLF), Home Bancshares Inc (HOMB), and Treehouse Foods Inc (THS).
Hodges Small Intrinsic Value Fund vs Russell 2000 Value Return Index & Russell 2000 Index
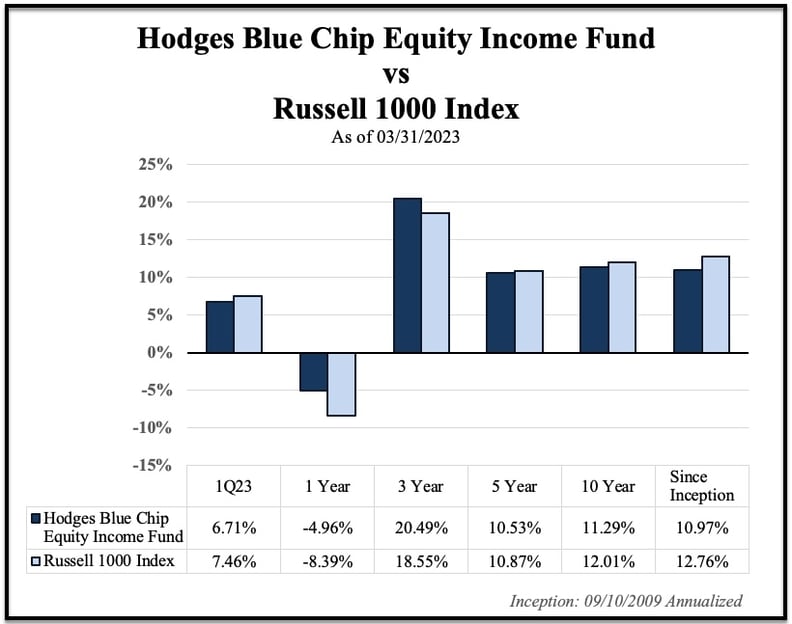
Hodges Blue Chip Equity Income Fund (HDPBX)
The Hodges Blue Chip Equity Income Fund was up 6.71% in the March Quarter of 2023, compared to a gain of 7.46% for the Russell 1000 Index. The Fund experienced a negative annualized return of 4.96% compared to a loss of 8.39% for the Russell 1000 Index. Lackluster relative performance in the recent quarter was attributed to sector allocation among energy and technology names. Although large-cap stocks have held up better than small and mid-cap stocks during the recent sell-off, we see the current investing landscape as offering plenty of attractive, high-quality dividend-paying stocks with solid upside potential. We expect underleveraged balance sheets and corporate profits across most blue-chip stocks to support stable dividends over the next several years. The Blue Chip Equity Income Fund remains well-diversified in companies that we believe can generate above-average income and total returns on a risk-adjusted basis. The Fund decreased its positions from 30 to 27 on March 31, 2023. The top ten holdings at the end of the quarter represented 49.15% of the Fund's holdings and included Apple Inc (AAPL), Microsoft Corp (MSFT), Deere & Co (DE), Exxon Mobil Corp (XOM), Tesla (TSLA), Texas Instruments Inc (TXN), Novo Nordisk (NVO), Nvidia (NVDA), PepsiCo Inc (PEP), and Costco Wholesale (COST).
Hodges Blue Chip Equity Income Fund vs Russell 1000 Index
In conclusion, we remain optimistic regarding the long-term investment opportunities surrounding the Hodges Mutual Funds. By offering four distinct mutual fund strategies covering most segments of the domestic equity market, we can serve most financial advisors and individual investors' diverse needs. Our entire investment team is rigorously studying companies, meeting with management teams, observing trends, and navigating today's ever-changing financial markets. Feel free to contact us directly if we can address any specific questions.
Learn more about Hodges Funds:
 |
 |
|||
 |
 |
The above discussion is based on the opinions of Eric Marshall, CFA, and is subject to change. It is not intended to be a forecast of future events, a guarantee of future results, and is not a recommendation to buy or sell any security. Portfolio composition and company ownership in the Hodges Funds are subject to daily change.
The Fund’s investment objectives, risks, charges and expenses must be considered carefully before investing. The statutory and summary prospectuses contain this and other important information about the Hodges Funds, and it may be obtained by calling 866-811-0224, or visiting www.hodgesmutualfunds.com. Read it carefully before investing.
Mutual fund investing involves risk. Principal loss is possible. Investments in foreign securities involve greater volatility and political, economic and currency risks and differences in accounting methods. These risks are greater for investments in emerging markets. Options and future contracts have the risks of unlimited losses of the underlying holdings due to unanticipated market movements and failure to correctly predict the direction of securities prices, interest rates and currency exchange rates. These risks may be greater than risks associated with more traditional investments. Short sales of securities involve the risk that losses may exceed the original amount invested. Investments in debt securities typically decrease in value when interest rates rise. This risk is usually greater for longer term debt securities. Investments in small and medium capitalization companies involve additional risks such as limited liquidity and greater volatility. Funds that are non-diversified are more exposed to individual stock volatility than a diversified fund. Investments in companies that demonstrate special situations or turnarounds, meaning companies that have experienced significant business problems but are believed to have favorable prospects for recovery, involve greater risk.
Value investing carries the risk that the market will not recognize a security’s inherent value for a long time, or that a stock judged to be undervalued may be appropriately priced or overvalued.
Diversification does not assure a profit or protect against a loss in a declining market.
Fund holdings and/or sector allocations are subject to change at any time and are not recommendations to buy or sell any security.
Investment performance reflects fee waivers in effect. In the absence of such waivers, total return would be reduced.
The S&P 500 Index is a broad-based unmanaged index of 500 stocks that is widely recognized as representative of the equity market in general. The Russell 1000 Index is a subset of the Russell 3000 Index and consists of the 1,000 largest companies comprising over 90% of the total market capitalization of all listed stocks. The Russell 2000 Index consists of the smallest 2,000 companies in a group of 3,000 U.S. companies in the Russell 3000 Index, as ranked by market capitalization. The Russell 2500 Index consists of the smallest 2,500 companies in a group of 3,000 U.S. companies in the Russell 3000 Index, as ranked by market capitalization. The Russell 3000 Index is a stock index consisting of the 3000 largest publicly listed companies, representing about 98% of the total capitalization of the entire U.S. stock market. The Russell 2000 Value Index measures the performance of small-cap value segment of the U.S. equity universe. It includes those Russell 2000 companies with lower price-to-book ratios and lower forecasted growth values. The Russell 2000 Value Index is constructed to provide a comprehensive and unbiased barometer for the small-cap value segment. The Index is completely reconstituted annually to ensure larger stocks do not distort the performance and characteristics of the true small-cap opportunity set and that the represented companies continue to reflect value characteristics. The NASDAQ Composite Index is an index of more than 3,000 common equities listed on the NASDAQ stock market. You cannot invest directly into an index.
Cash Flow: A revenue or expense stream that changes a cash account over a given period.
Price/earnings (P/E): The most common measure of how expensive a stock is.
Earnings Growth is not a measure of the Fund’s future performance.
Hodges Capital Management is the Advisor to the Hodges Funds.
Hodges Funds are distributed by Quasar Distributors LLC.